Growing Up Liberian: Visualizing Big Data
In the United States, we take the Census for granted. Every 10 years a gargantuan effort is undertaken to count every person in the country. This data powers policy, politics, and business.
We worked with the Population Council on a data powered digital product to make it easy for Liberian policymakers, journalists, and other interested stakeholders to view and analyze the Liberian 2008 Census. Liberia conducted another census this year, but until this new data becomes available the 2008 census remains the most comprehensive data picture of Liberian lives.
This project was both challenging and fun. The project required quite a bit of core data work, branding (including culturally sensitive illustration), and UX/UI work to make everything easy to use.
Data
Liberia isn't a big country, but nonetheless any census can be considered a large dataset. We spent quite a bit of time figuring out the data structure for the web application. The data structure needed to be comprehensive and retrieval fast. Once the data structure was set, I wrote a series of Stata (easily adaptable to R) routines to extract and populate the data structure.
Illustration
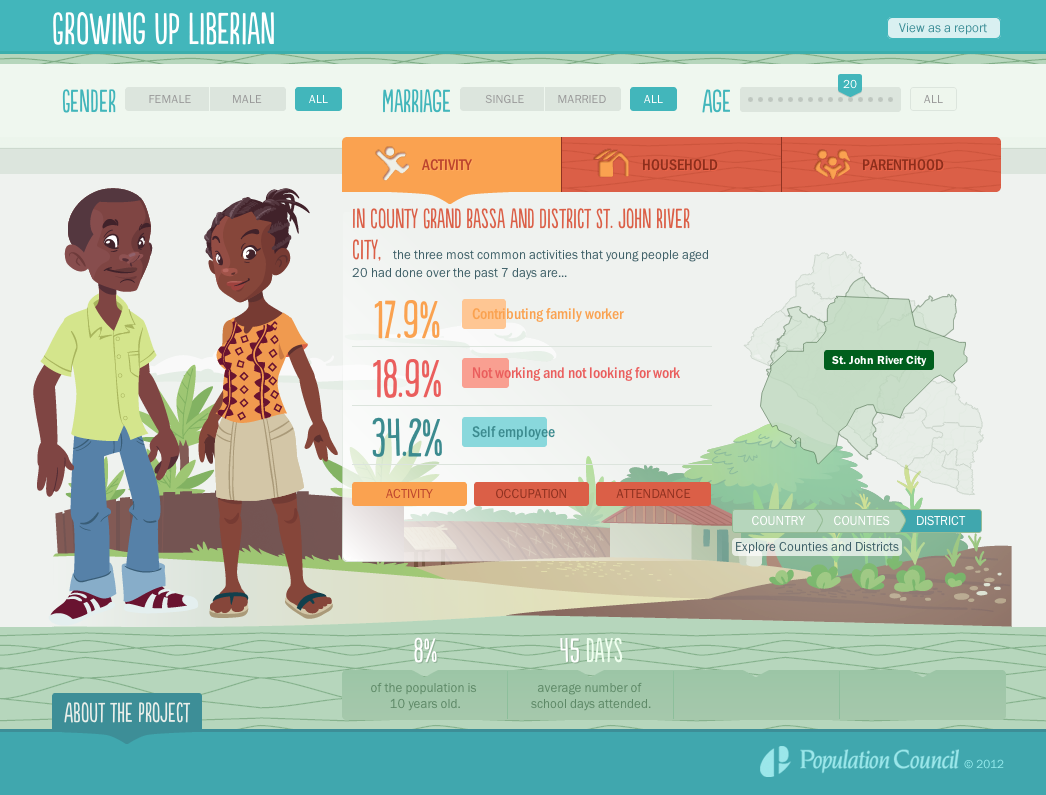
We worked with an illustrator to create vector-based characters for the interface. The characters changed depending on the query (e.g. age and martial status). We were especially concerned with making the characters culturally appropriate. We made sure to get input from Liberians on all aspects of the illustration including the characters themselves as well as the landscape (urban, rural, peri-urban) behind the characters.
User Experience
Our term for the interface was a story-based interface. Rather than using dry language of statistics and data, we wanted people to ask real world questions in an accessible way that was then translated on the backend into a data query.
Here is a screencast of the web application: